0x00 前言
还是比较习惯用PHPStorm的,这里主要介绍本地调试和远程调试
0x01 环境
下载xdebug
这里需要用到xdebug插件
如果用的PHPStudy的小皮环境,在ext扩展下面都是存在xdebug插件的
如果没有的,可以在官网下载,选择自己需要的版本就可以
0x02 配置
本地调试
本地调试其实比较简单,配置用不了那么多
但是我们在ini文件中用统一的参数,关键看PHPStorm软件中是否设置
php环境7.3.4
修改ini文件
1
2
3
4
5
6
7
8
9
10
11
12
13
14
15
16
17
| [XDebug]
xdebug.profiler_output_dir ="E:\phpstudy\directory\phpstudy_pro\Extensions\tmp\xdebug"
xdebug.trace_output_dir="E:\phpstudy\directory\phpstudy_pro\Extensions\tmp\xdebug"
zend_extension="E:\phpstudy\directory\phpstudy_pro\Extensions\php\php7.3.4nts\ext\php_xdebug.dll"
xdebug.remote_enable = On
xdebug.remote_autostart=On
xdebug.remote_host = "127.0.0.1"
xdebug.remote_port = 10000
xdebug.remote_handler = "dbgp"
xdebug.idekey="PHPSTORM"
xdebug.profiler_enable = off
xdebug.profiler_enable_trigger = off
xdebug.profiler_output_name = cachegrind.out.%t.%p
|
在ini文件的最下面添加
配置phpstorm
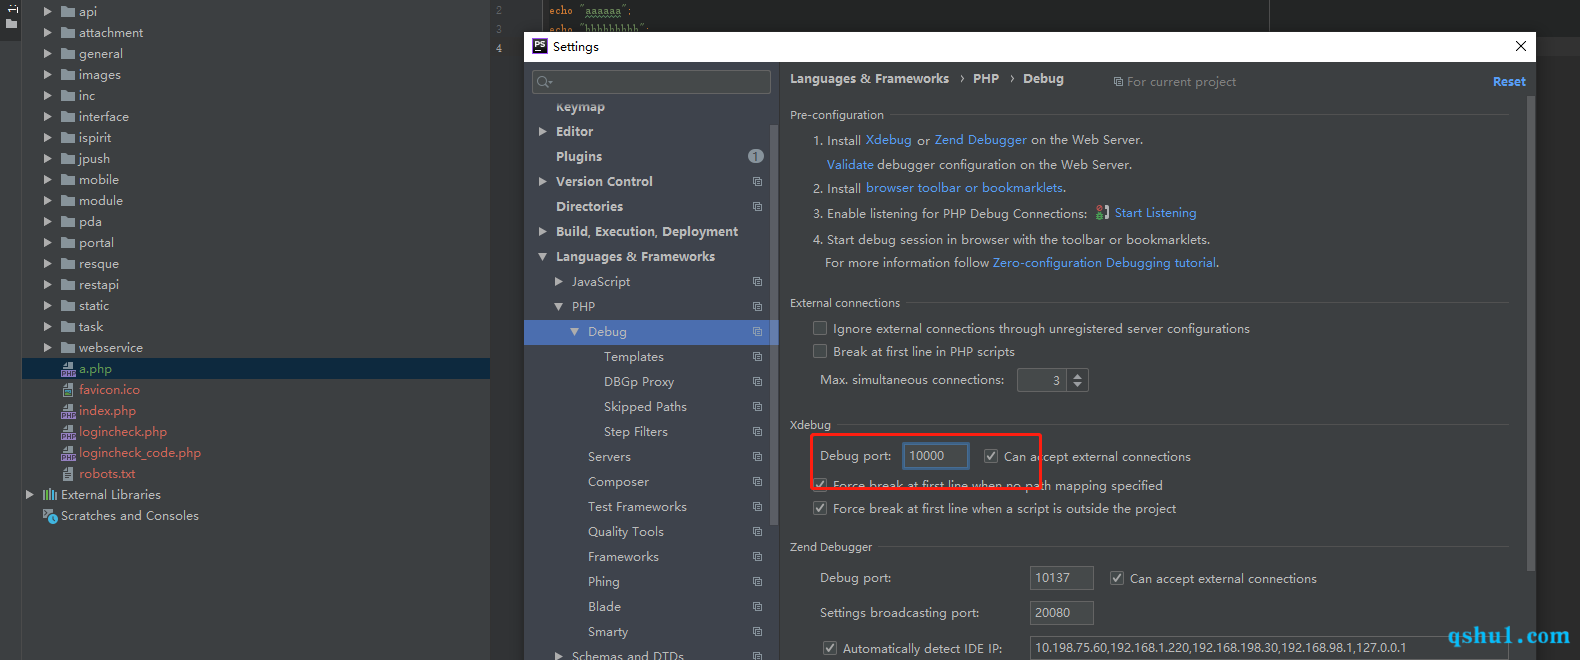
选择File->setting->Languages&Frameworks->PHP
PHP环境
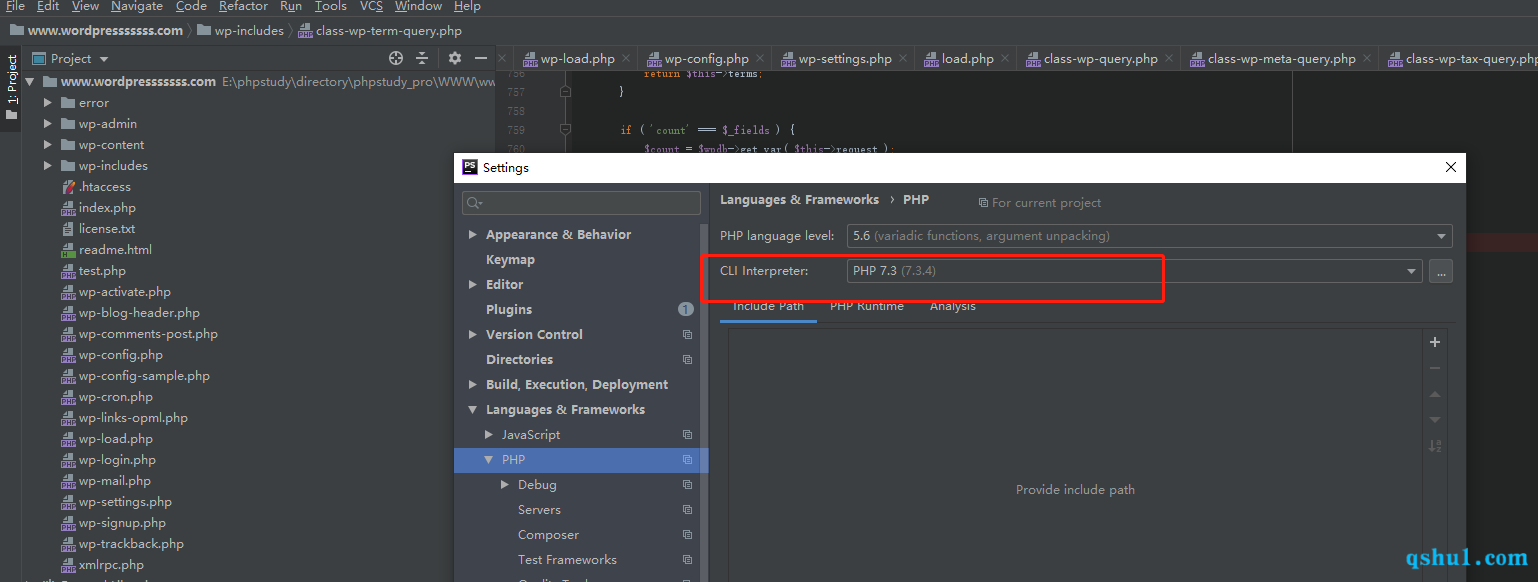
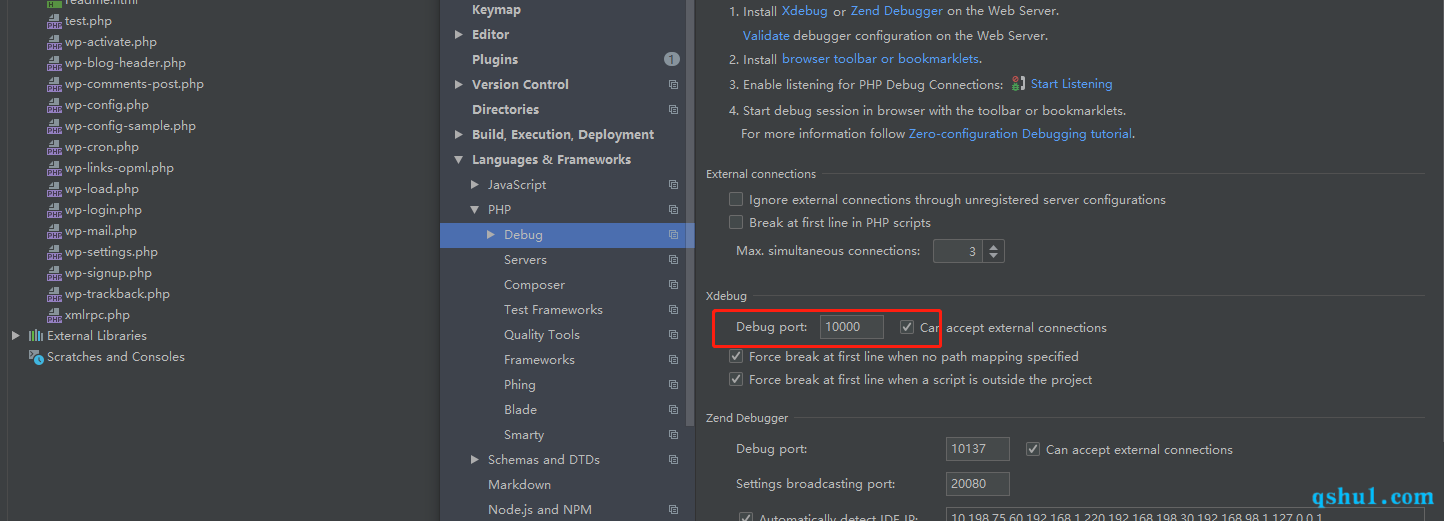
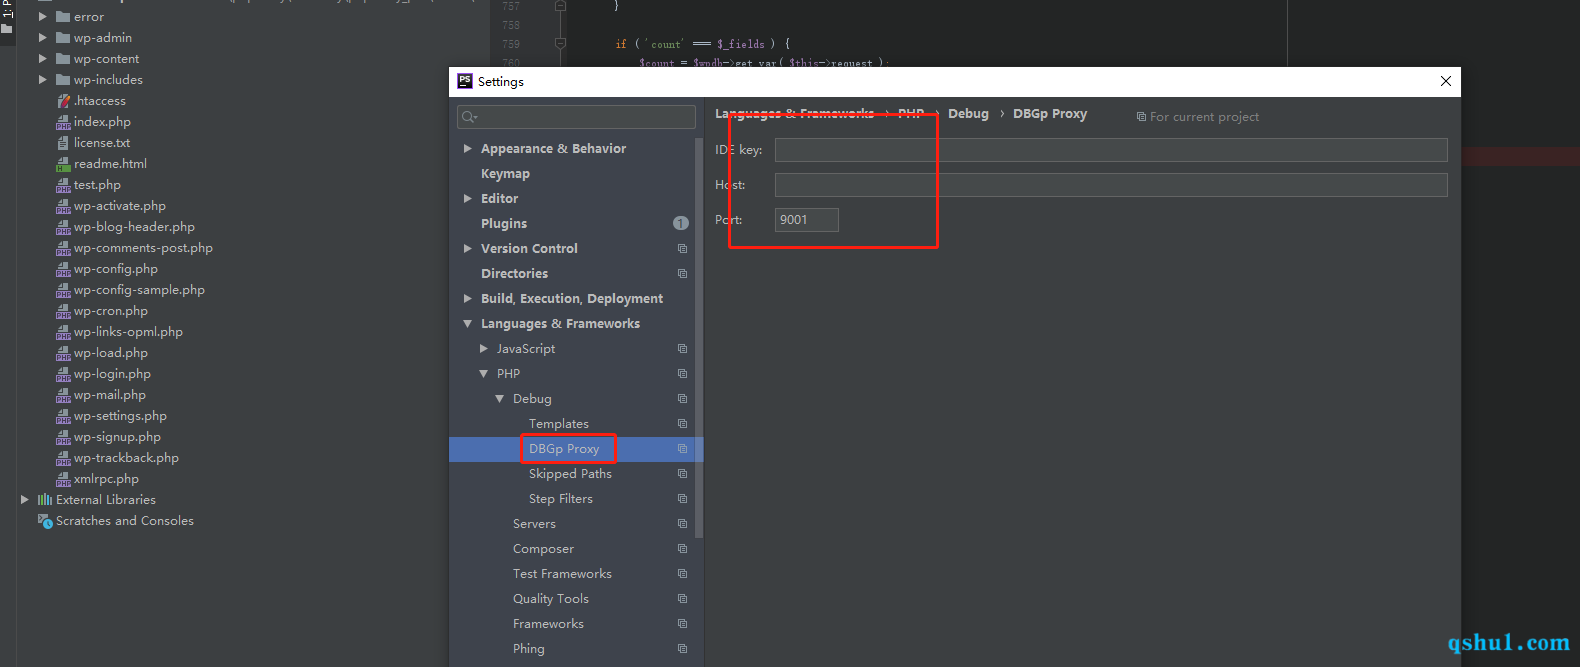
配置debug port为我们在ini中设置的端口
在本地调试中,这一处可以不用配置
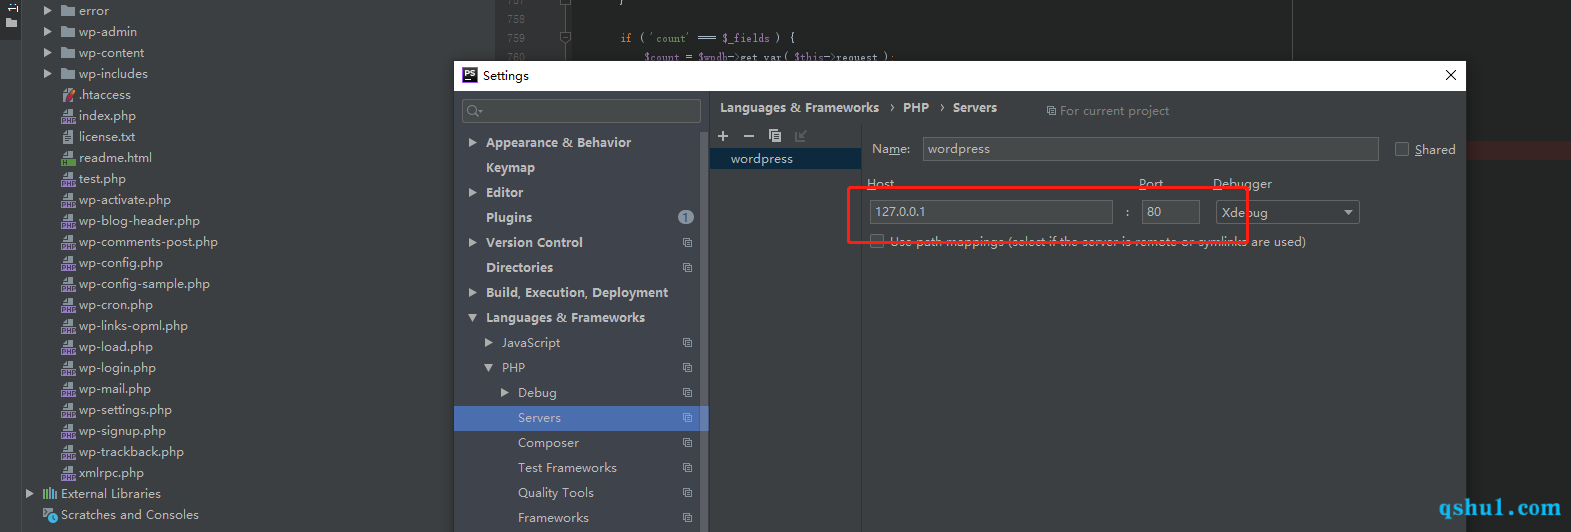
在配置server,这里host和端口随意,名字也随意
点击ok保存后可以测试一下
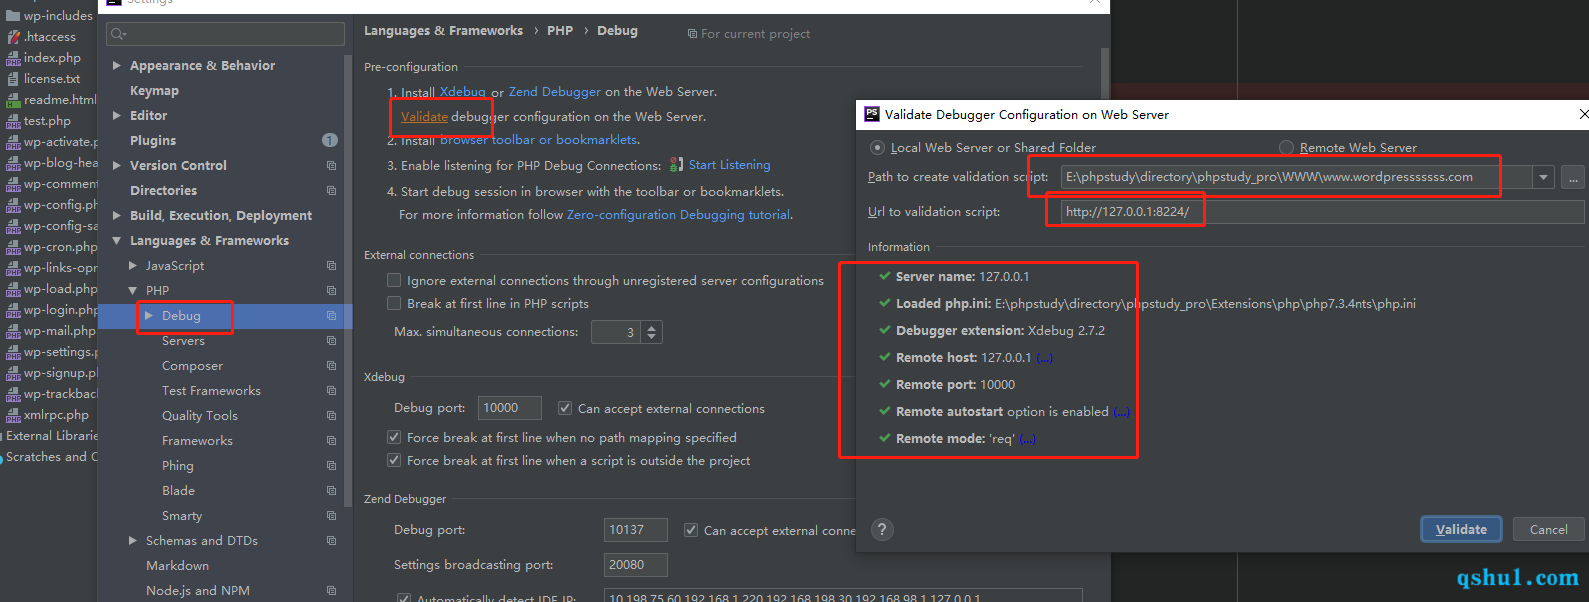
没有问题,然后打开
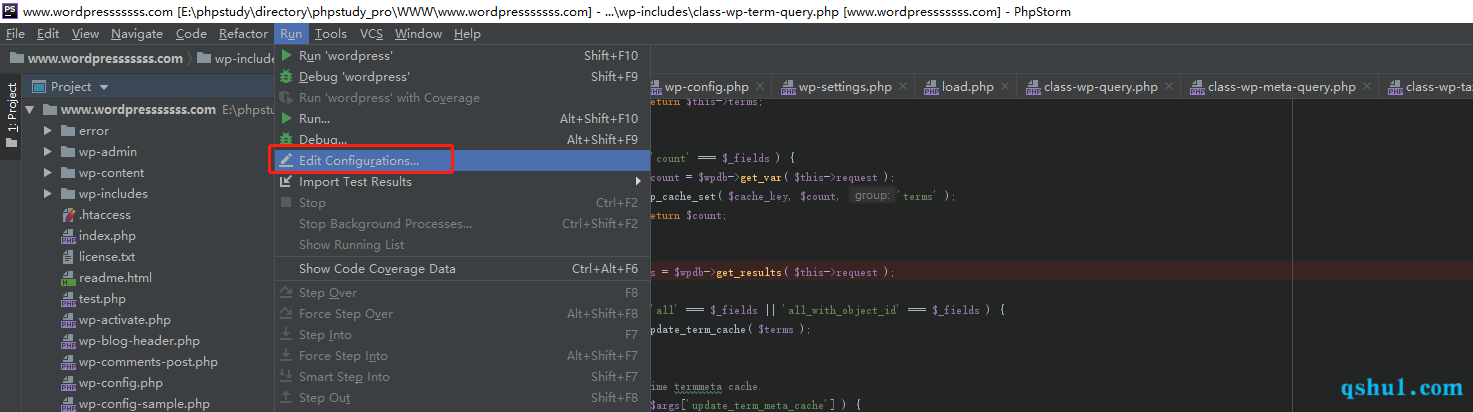
选择PHP web page
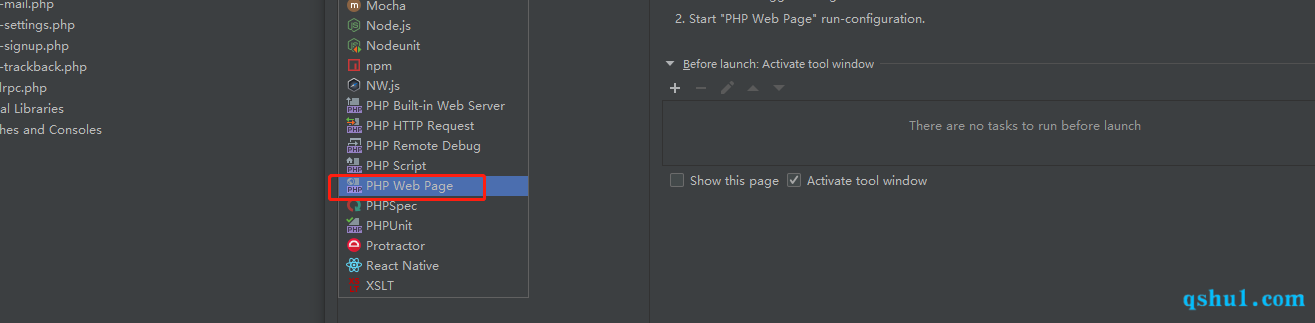
然后如下设置
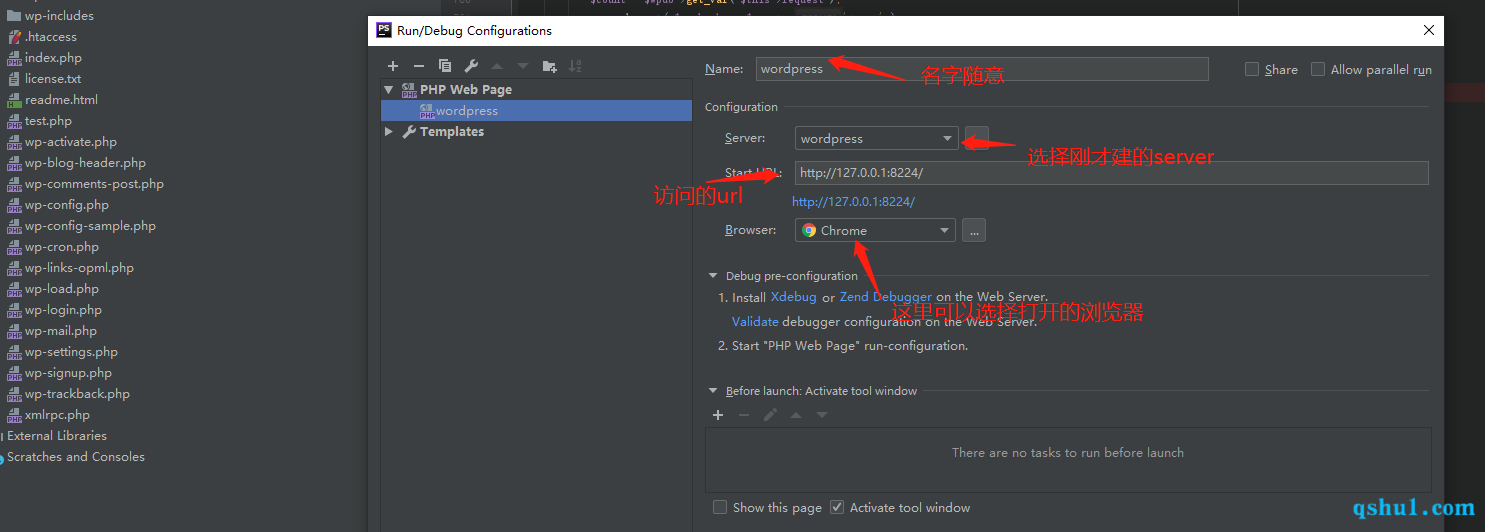
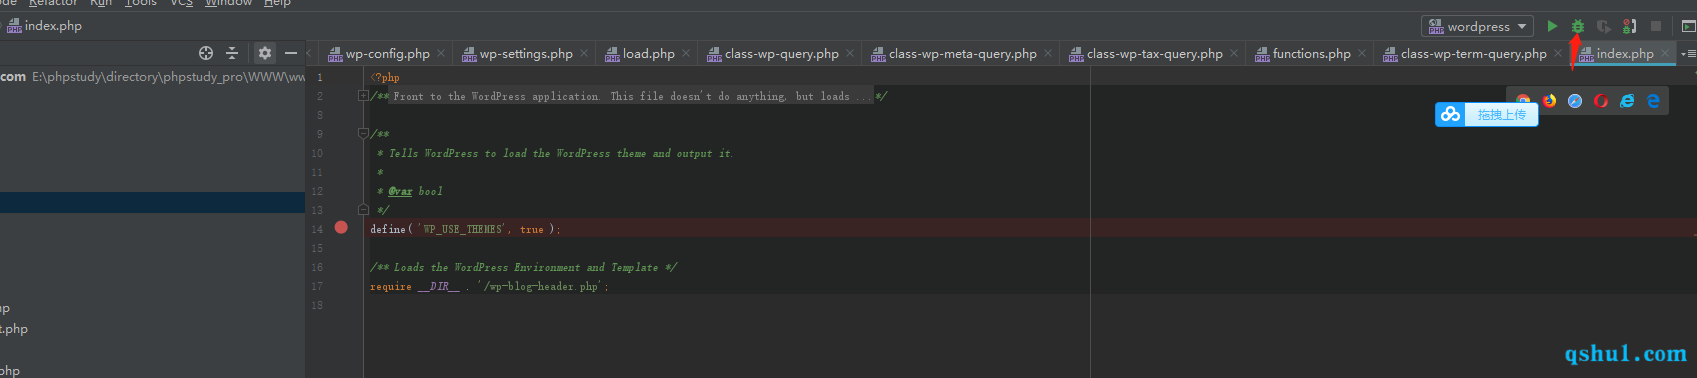
保存之后我们设置一个断点
直接点击debug就可以,旁边那个小电话的图标可以开,也可以不开
当然通过这样配置的经常是关了phpstorm之后,设置的端口依然被占用,终止一下进程就可以了
1
2
3
| netstat -ano | findstr [设置的debug端口] //获取pid
TASKKILL /F /IM [获取到的pid]
|
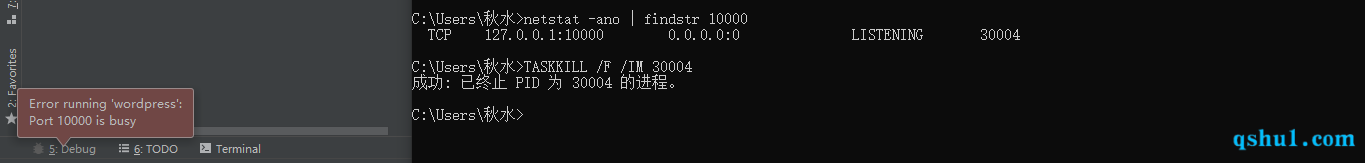
如果遇到不管用的情况记得把旁边的小电话打开
远程调试
可能步骤还能削减,我这里没试
在远程搭了个通达,用的是php5.6
- 远程服务器地址:
192.168.198.129
- 本地地址:
192.168.1.220
本地ini配置
1
2
3
4
5
6
7
8
9
10
11
12
| [XDebug]
xdebug.profiler_output_dir ="E:\phpstudy\directory\phpstudy_pro\Extensions\tmp\xdebug"
xdebug.trace_output_dir="D:\phpstudy\directory\phpstudy_pro\Extensions\tmp\xdebug"
zend_extension="D:\phpstudy\directory\phpstudy_pro\Extensions\php\php5.6.9nts\ext\php_xdebug.dll"
xdebug.remote_enable = On
xdebug.remote_host = "127.0.0.1"
xdebug.remote_port = 10000
xdebug.remote_handler = "dbgp"
xdebug.idekey="PHPSTORM"
xdebug.profiler_enable = off
xdebug.profiler_enable_trigger = off
xdebug.profiler_output_name = cachegrind.out.%t.%p
|
远程ini配置
1
2
3
4
5
6
7
8
9
10
11
12
| [XDebug]
xdebug.profiler_output_dir ="D:\MYOA\tmp\xdebug"
xdebug.trace_output_dir="D:\MYOA\tmp\xdebug"
zend_extension="D:\MYOA\bin\ext\php_xdebug.dll"
xdebug.remote_enable = On
xdebug.remote_host = "192.168.1.220"
xdebug.remote_port = 10000
xdebug.remote_handler = "dbgp"
xdebug.idekey="PHPSTORM"
xdebug.profiler_enable = off
xdebug.profiler_enable_trigger = off
xdebug.profiler_output_name = cachegrind.out.%t.%p
|
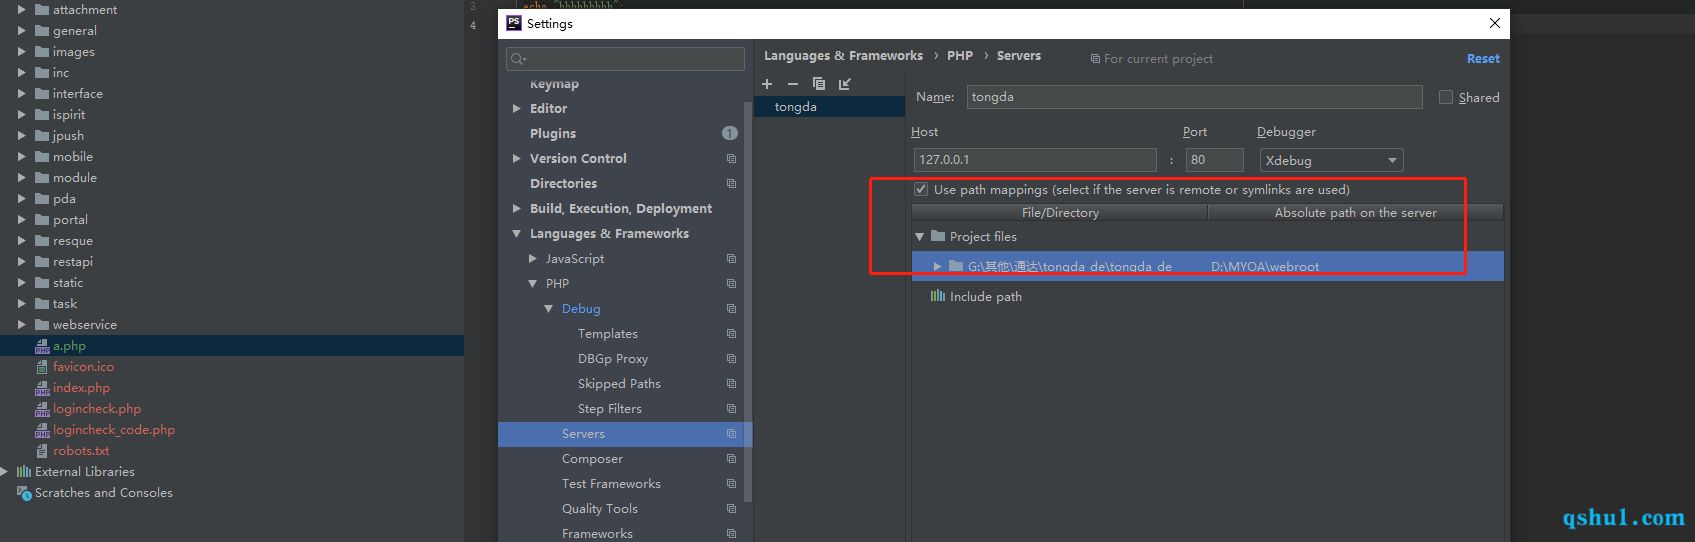
配置phpstorm
填写端口
配置server,记得勾选路径映射
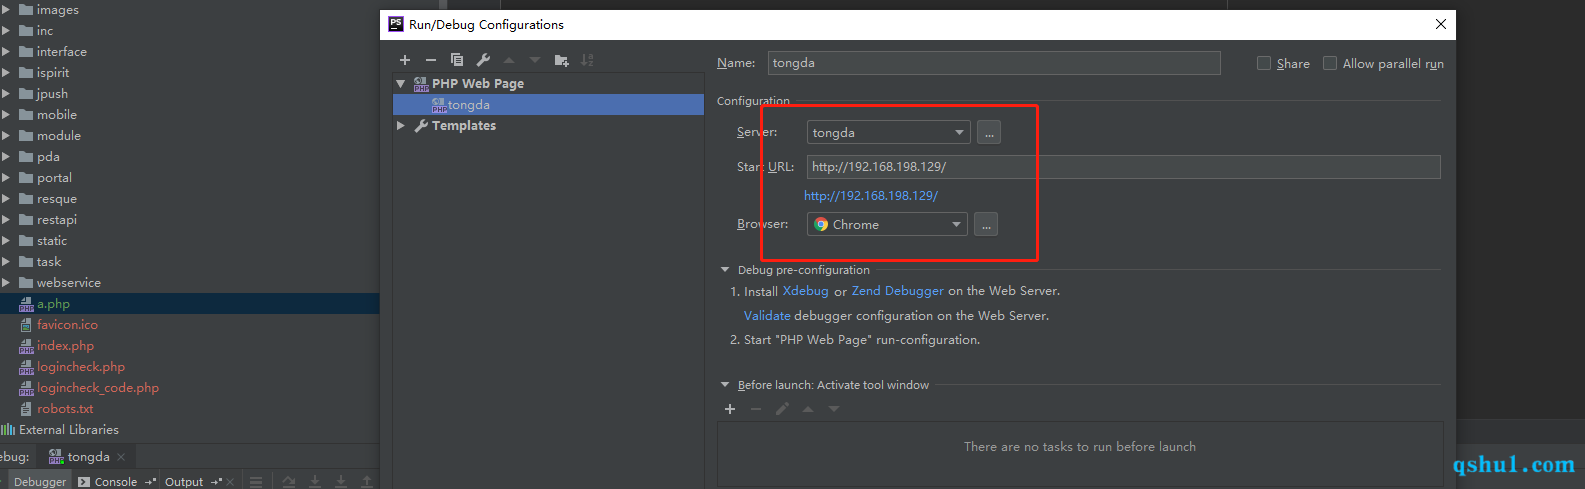
和之前一样新增一个PHP web page
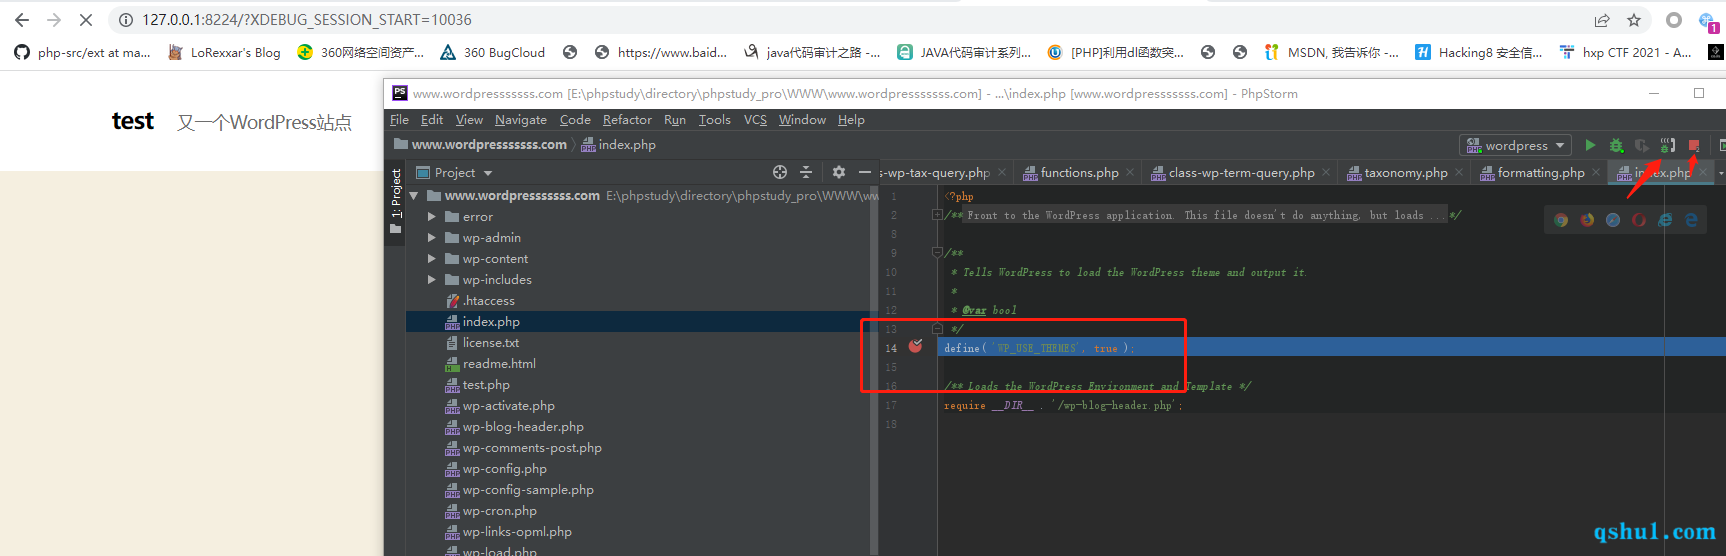
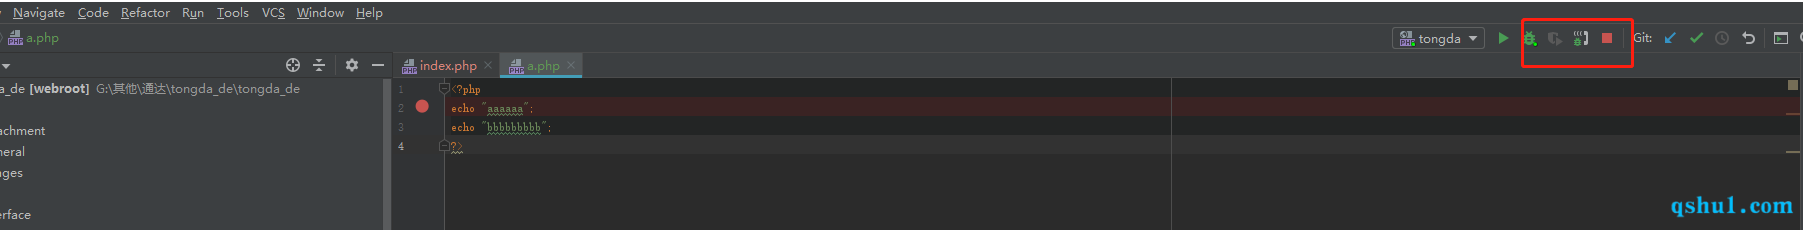
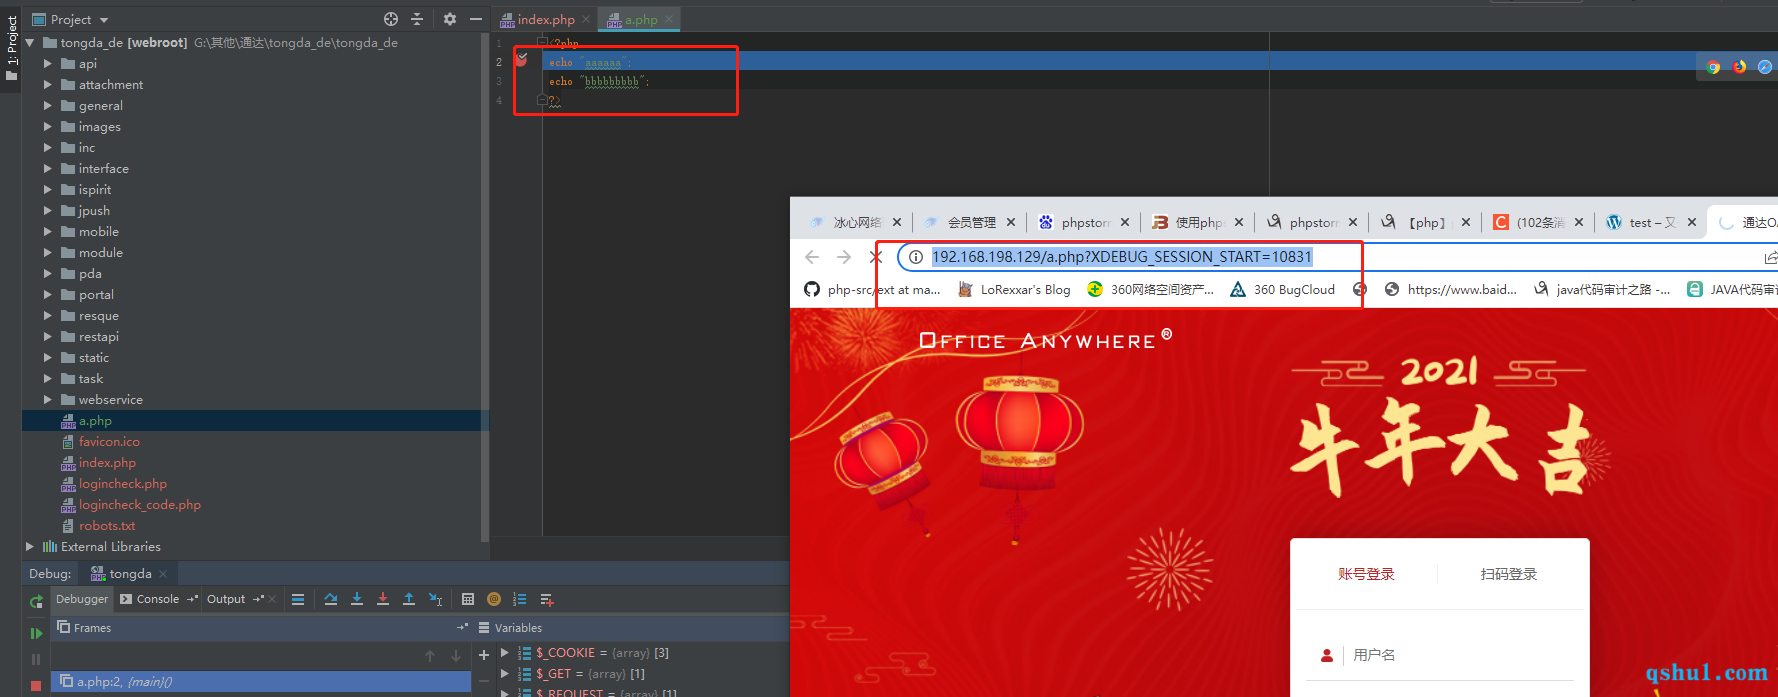
然后打开监听
可以看到已经成功
0x03 end
…